How to open an html file in chrome: How to Open HTML Files i

Sidharth Nayyar
You’ve got an index.html on your desktop, you double-click it, and one of two things happens. Chrome opens it immediately, or Chrome opens it and half the page doesn’t work.
That split is why most guides on how to open an html file in chrome feel incomplete. Opening a static file is easy. Opening it in a way that helps you test layout, JavaScript behavior, asset loading, and accessibility before deployment takes a little more judgment.
The good news is that you usually don’t need much setup. The better news is that once you know where Chrome’s local file behavior gets strict, you can pick the right workflow fast instead of fighting random errors.
Quick Guide The TLDR for Opening HTML Files
Use this decision aid instead of trying methods at random.
- You just need a fast visual preview: double-click the file or drag it into an open Chrome tab. This opens the page over the
file://protocol, which is usually enough for a plain HTML page or a quick layout review. I use drag-and-drop most when I already have DevTools open, because it is the fastest way to swap between local versions without touching menus. - The file keeps opening in the wrong app: right-click the file and choose Open with > Chrome. This still uses
file://, but it gives you manual control when your system sends.htmlfiles to Safari, Edge, a code editor, or another browser. The common failure point here is not Chrome at all, it is your OS file association. - You want to open the file from inside the browser: press Ctrl+O on Windows/Linux or Cmd+O on macOS, then choose the HTML file. This is the most teachable method for teams because everyone follows the same path inside Chrome. The usual mistake is selecting the wrong copy of the file from Downloads, Desktop, or a synced folder and then debugging the wrong page.
- You know the exact location and want to open it directly: paste the file path into Chrome as a
file:///address. This is handy when you are testing the same page repeatedly and want a direct path in the address bar. The most common failure is an incorrect path format or a moved file, which makes Chrome show a missing-file error instead of the page. - The page uses JavaScript modules,
fetch(), JSON, or app-like behavior: run it through a local server such ashttp://localhostinstead of opening the file directly. That changes the environment from a local-file context to a web-server context, which avoids many restrictions that break interactive pages. In my testing, this is the line where people stop saying "Chrome is broken" and realize the page needs to be served, not just opened. Before QA or staging, run an accessibility checker so you do not sign off on a page that only looked correct in a limited local setup.
Chrome remains the practical default for this workflow partly because of market share: one recent summary notes that Chrome held about 64.3% of the global desktop browser market, which helps explain why teams so often document the Chrome path first in internal QA steps and client handoff notes, as covered in this browser workflow overview.
If you need to run code rather than just preview markup, skip to the local server method.
How I Tested These Ways to Open HTML in Chrome
I compared the methods as they are commonly used: opening a plain index.html, opening a page with linked CSS and JavaScript, and opening a page that relied on module imports and fetch() calls. I tested direct opening through double-click, drag-and-drop, Chrome’s file picker, and a pasted file:/// path, then compared those results with the same files served over http://localhost.
I also checked what would make a method unsuitable for real development or QA. A method failed that standard if it rendered the page but hid broken assets, blocked JavaScript behavior, or made accessibility testing misleading because scripts were not running the way they would on a real site. That distinction matters more than people think: a page that “opens” is not always a page that is safe to sign off.
For basic preview, the workflow has barely changed across major desktop platforms: right-click and open with Chrome, drag the file into a tab, use Chrome’s open command, or paste the file path directly, as outlined in this practical local-file walkthrough. The methods are simple; the difference is whether your page needs a browser tab or a browser environment.
The Easiest Ways to View Your Local HTML File
When you only need to inspect a local page, keep it simple. The best method depends on what you’re doing, not on some universal rule.
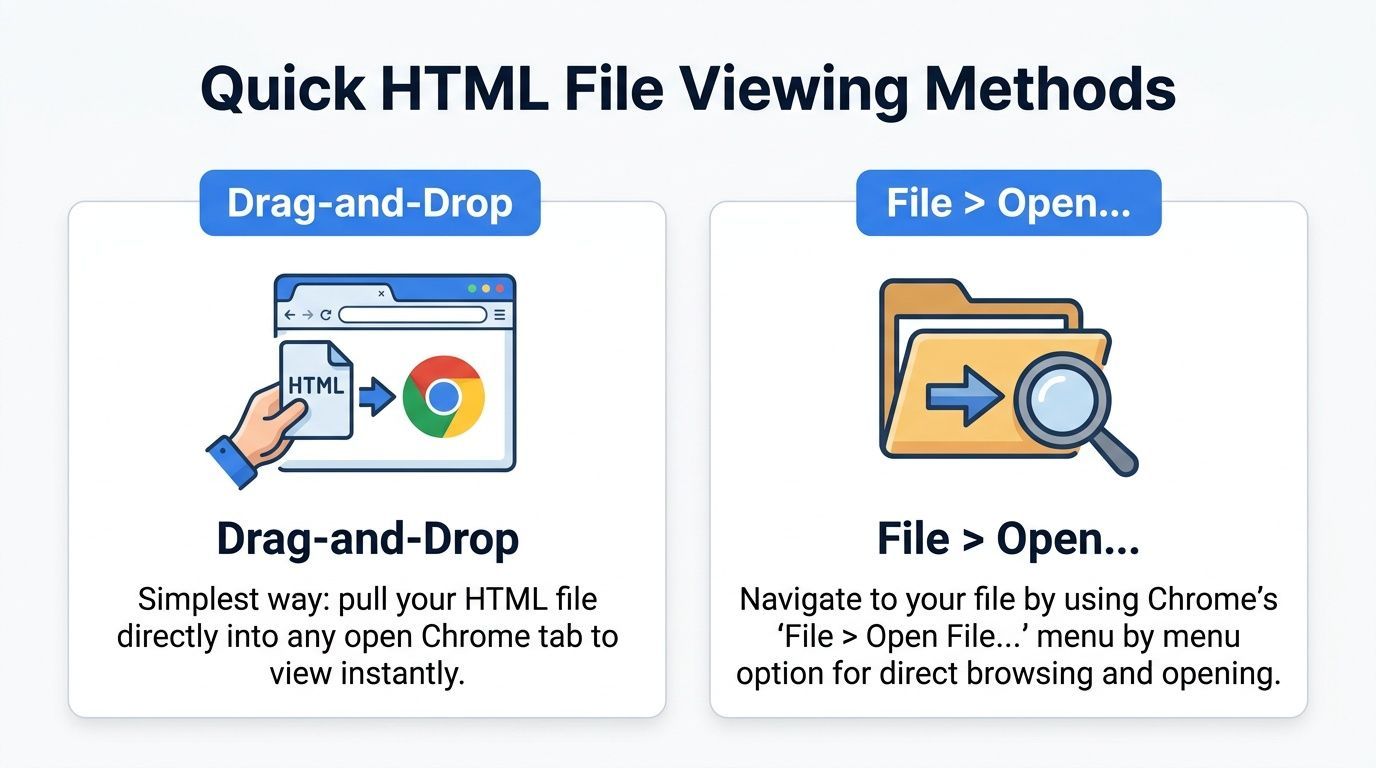
Double-click when Chrome is already your default
This is the cleanest path for quick previews.
If your machine already sends .html files to Chrome, double-clicking is usually enough. It’s best when you’re opening one file, checking a text change, or validating that a static page renders at all.
Use this when:
- You’re checking a single file
- You don’t need to choose a browser manually
- You want the least friction possible
This is also the method many juniors try first, and that’s fine. Don’t overcomplicate a simple preview.
Drag and drop when you’re already inside Chrome
This is my preferred option when I’ve already got DevTools open.
Grab the HTML file from Finder or File Explorer and drop it into an open Chrome tab. Chrome renders it through the file:// protocol immediately, which makes it handy for rapid visual checks.
It works well when:
- You’re hopping through multiple versions of the same file
- You keep a browser window open during edits
- You want to avoid browsing through menus
Open with Chrome when defaults get in the way
Sometimes the file opens in Safari, Edge, or a code editor. That’s not a bug. That’s just the system honoring its file association settings.
Right-click the file, choose Open with, then pick Chrome. This is the safer option when you share a machine, test across browsers, or don’t want to change your global default browser just to open one file.
If you compare browser behavior often, keep this guide to the WAVE extension for Chrome handy after opening the file. It’s useful when the next step is reviewing accessibility feedback right in the browser.
Use Chrome’s file picker for a repeatable workflow
Inside Chrome, go to File > Open File. On most systems, the keyboard shortcut is faster, but the menu is easier to remember if you’re teaching someone or documenting a process for a team.
Open from inside Chrome when you want a repeatable path that works the same way across projects.
That consistency matters more than people think, especially on teams where designers, QA testers, and developers all touch local HTML files for different reasons.
How to View HTML Code Directly in Chrome
Sometimes people say they want to open HTML code in Chrome when they mean one of two different tasks: render the page in the browser, or inspect the underlying HTML. Chrome can do both, but the steps are different.
If you want to render the page, open the .html file normally through double-click, drag-and-drop, Open File, or a file:/// path. Chrome will display the page as a browser would, which is the right approach for checking layout, text, and visual structure.
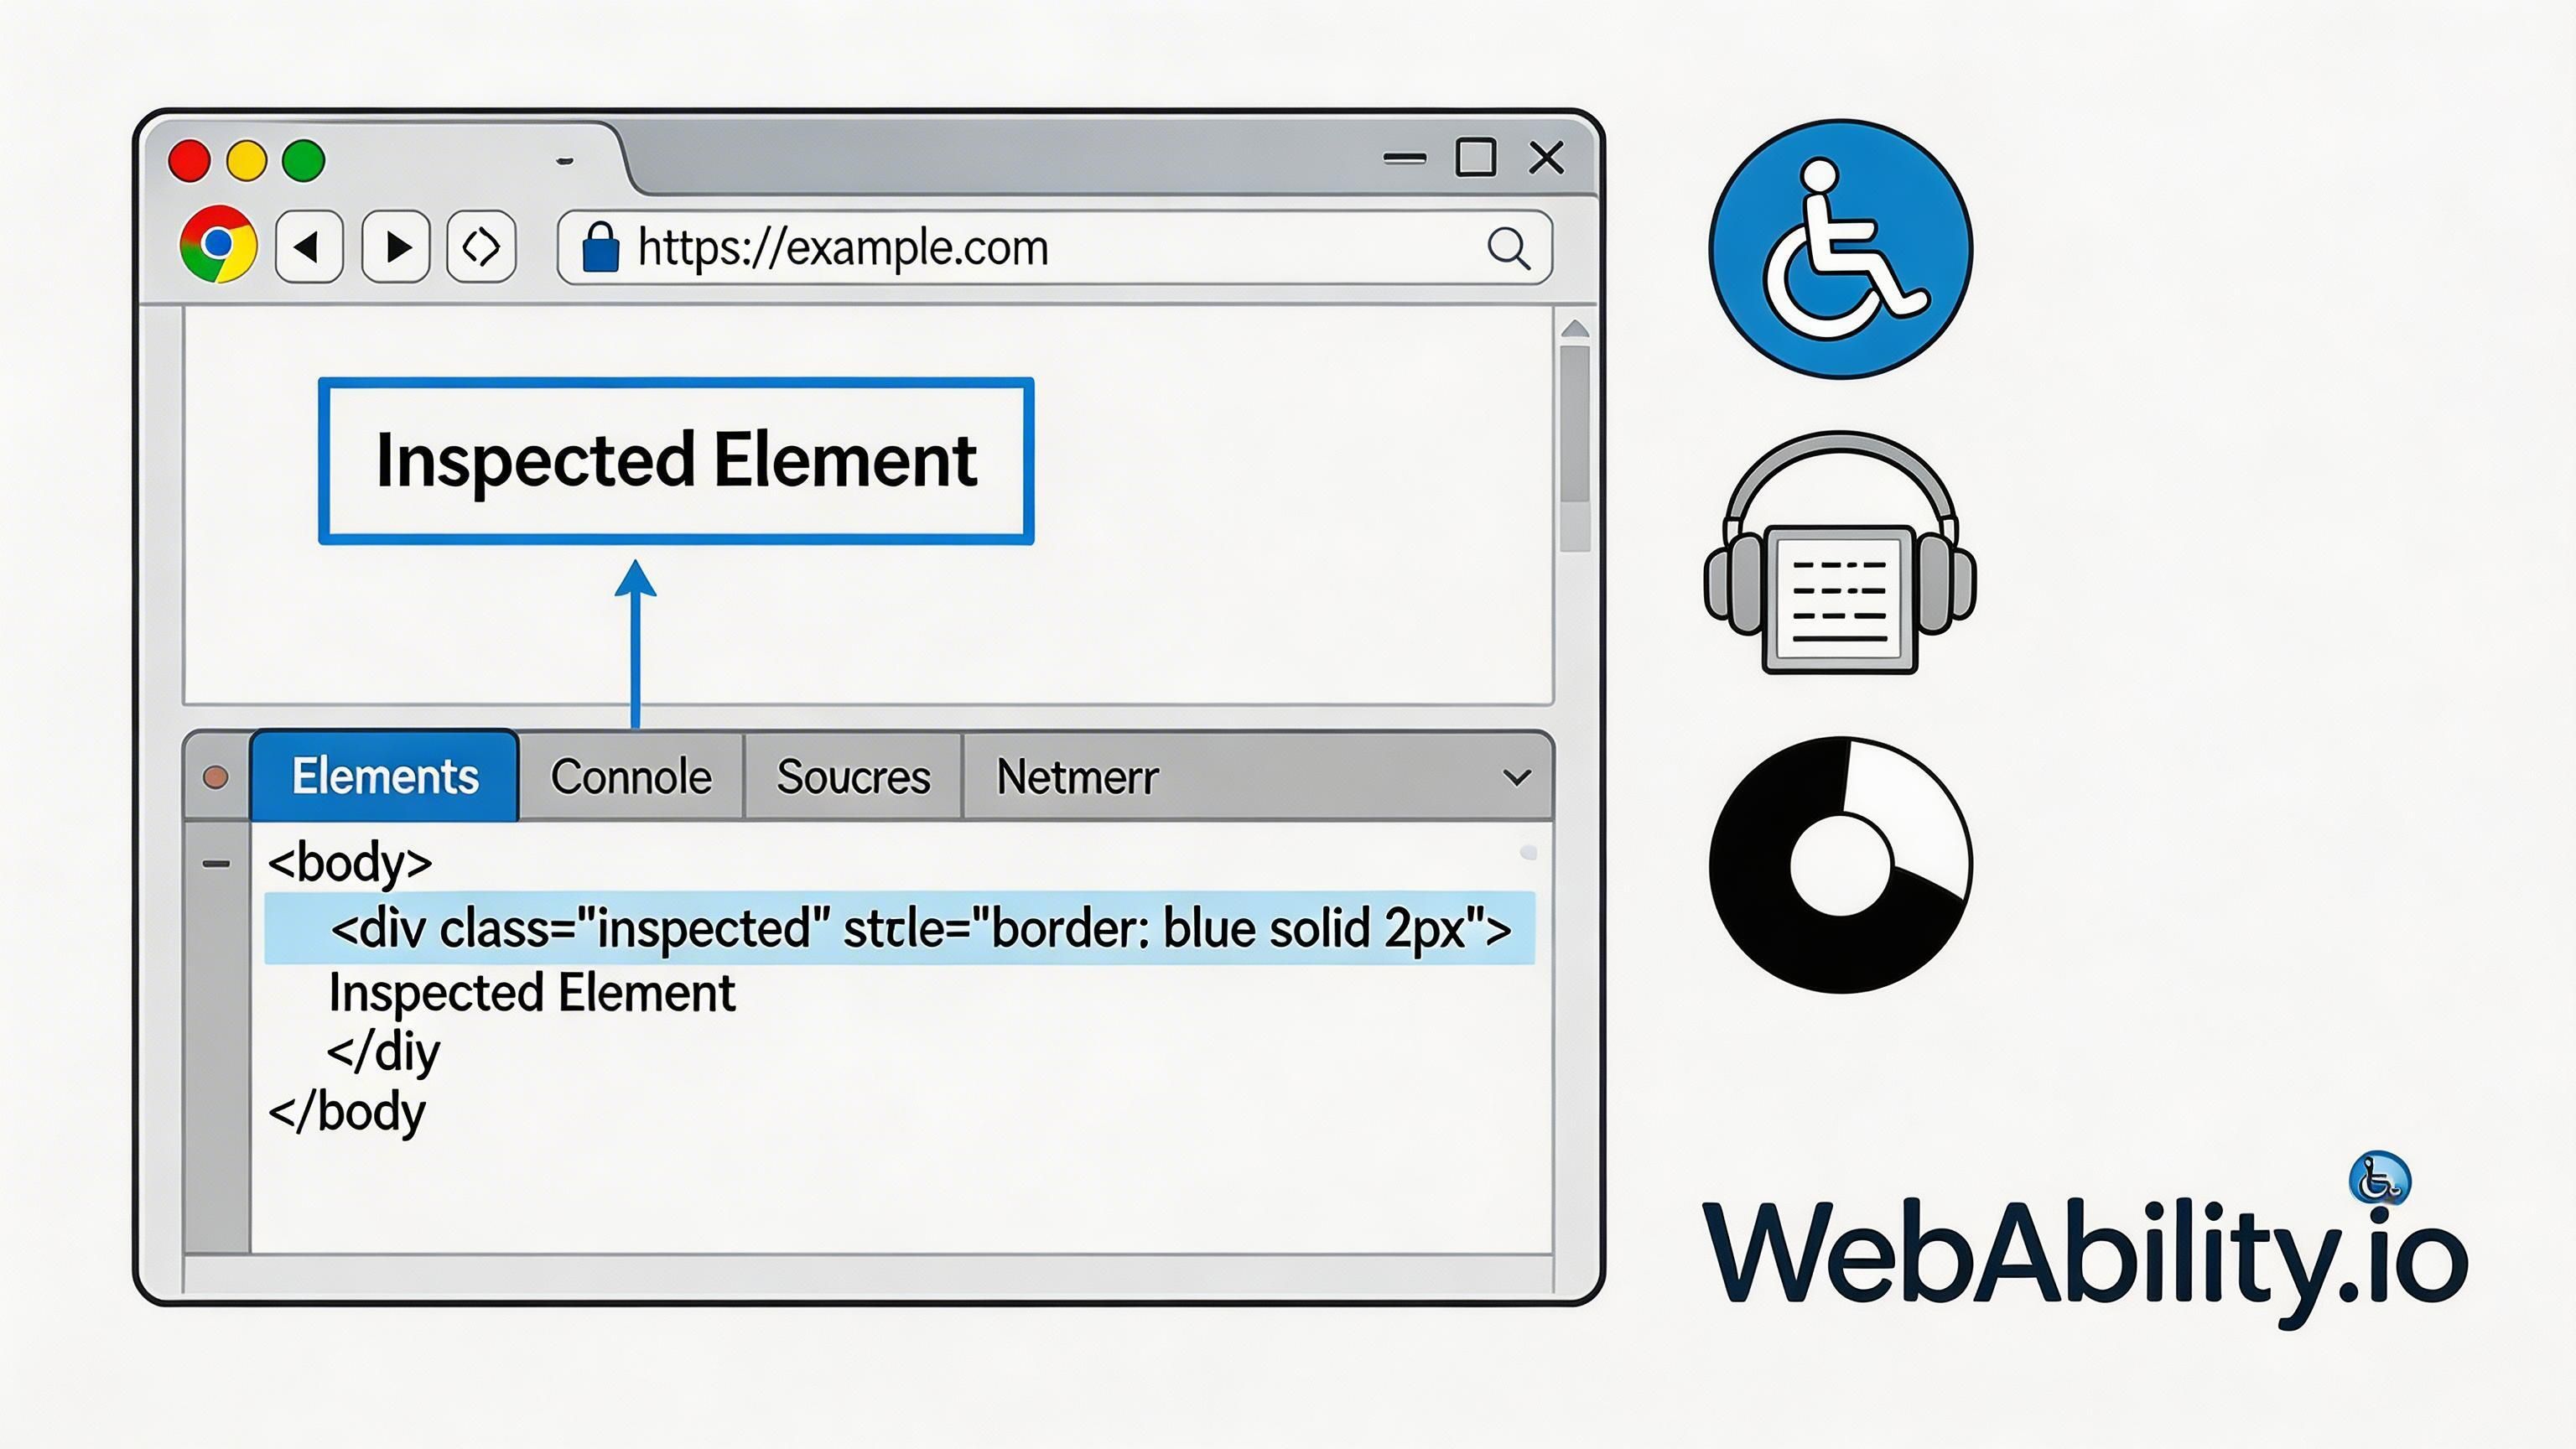
If you want to inspect the live HTML structure, open the page and then use DevTools. Right-click anywhere on the page and choose Inspect, or press Ctrl+Shift+I on Windows/Linux or Cmd+Option+I on macOS. In the Elements panel, you can expand nodes, see attributes, and check whether JavaScript has changed the DOM after load.
If you want to view the source file itself, use View Page Source on a rendered page or press Ctrl+U / Cmd+Option+U. That shows the original HTML document Chrome received or opened, not the live DOM after scripts run. I use source view when I want to confirm what the file contains, and DevTools when I want to confirm what the browser ended up rendering.
Chrome’s DevTools documentation is the best reference here if you need a refresher on inspecting DOM structure in the browser; the official Chrome DevTools Elements panel guide walks through the inspection flow clearly.
Developer Methods Using a Local Server and Terminal
Opening a file directly is fine until the page starts behaving like an app. Then file:// becomes the problem.
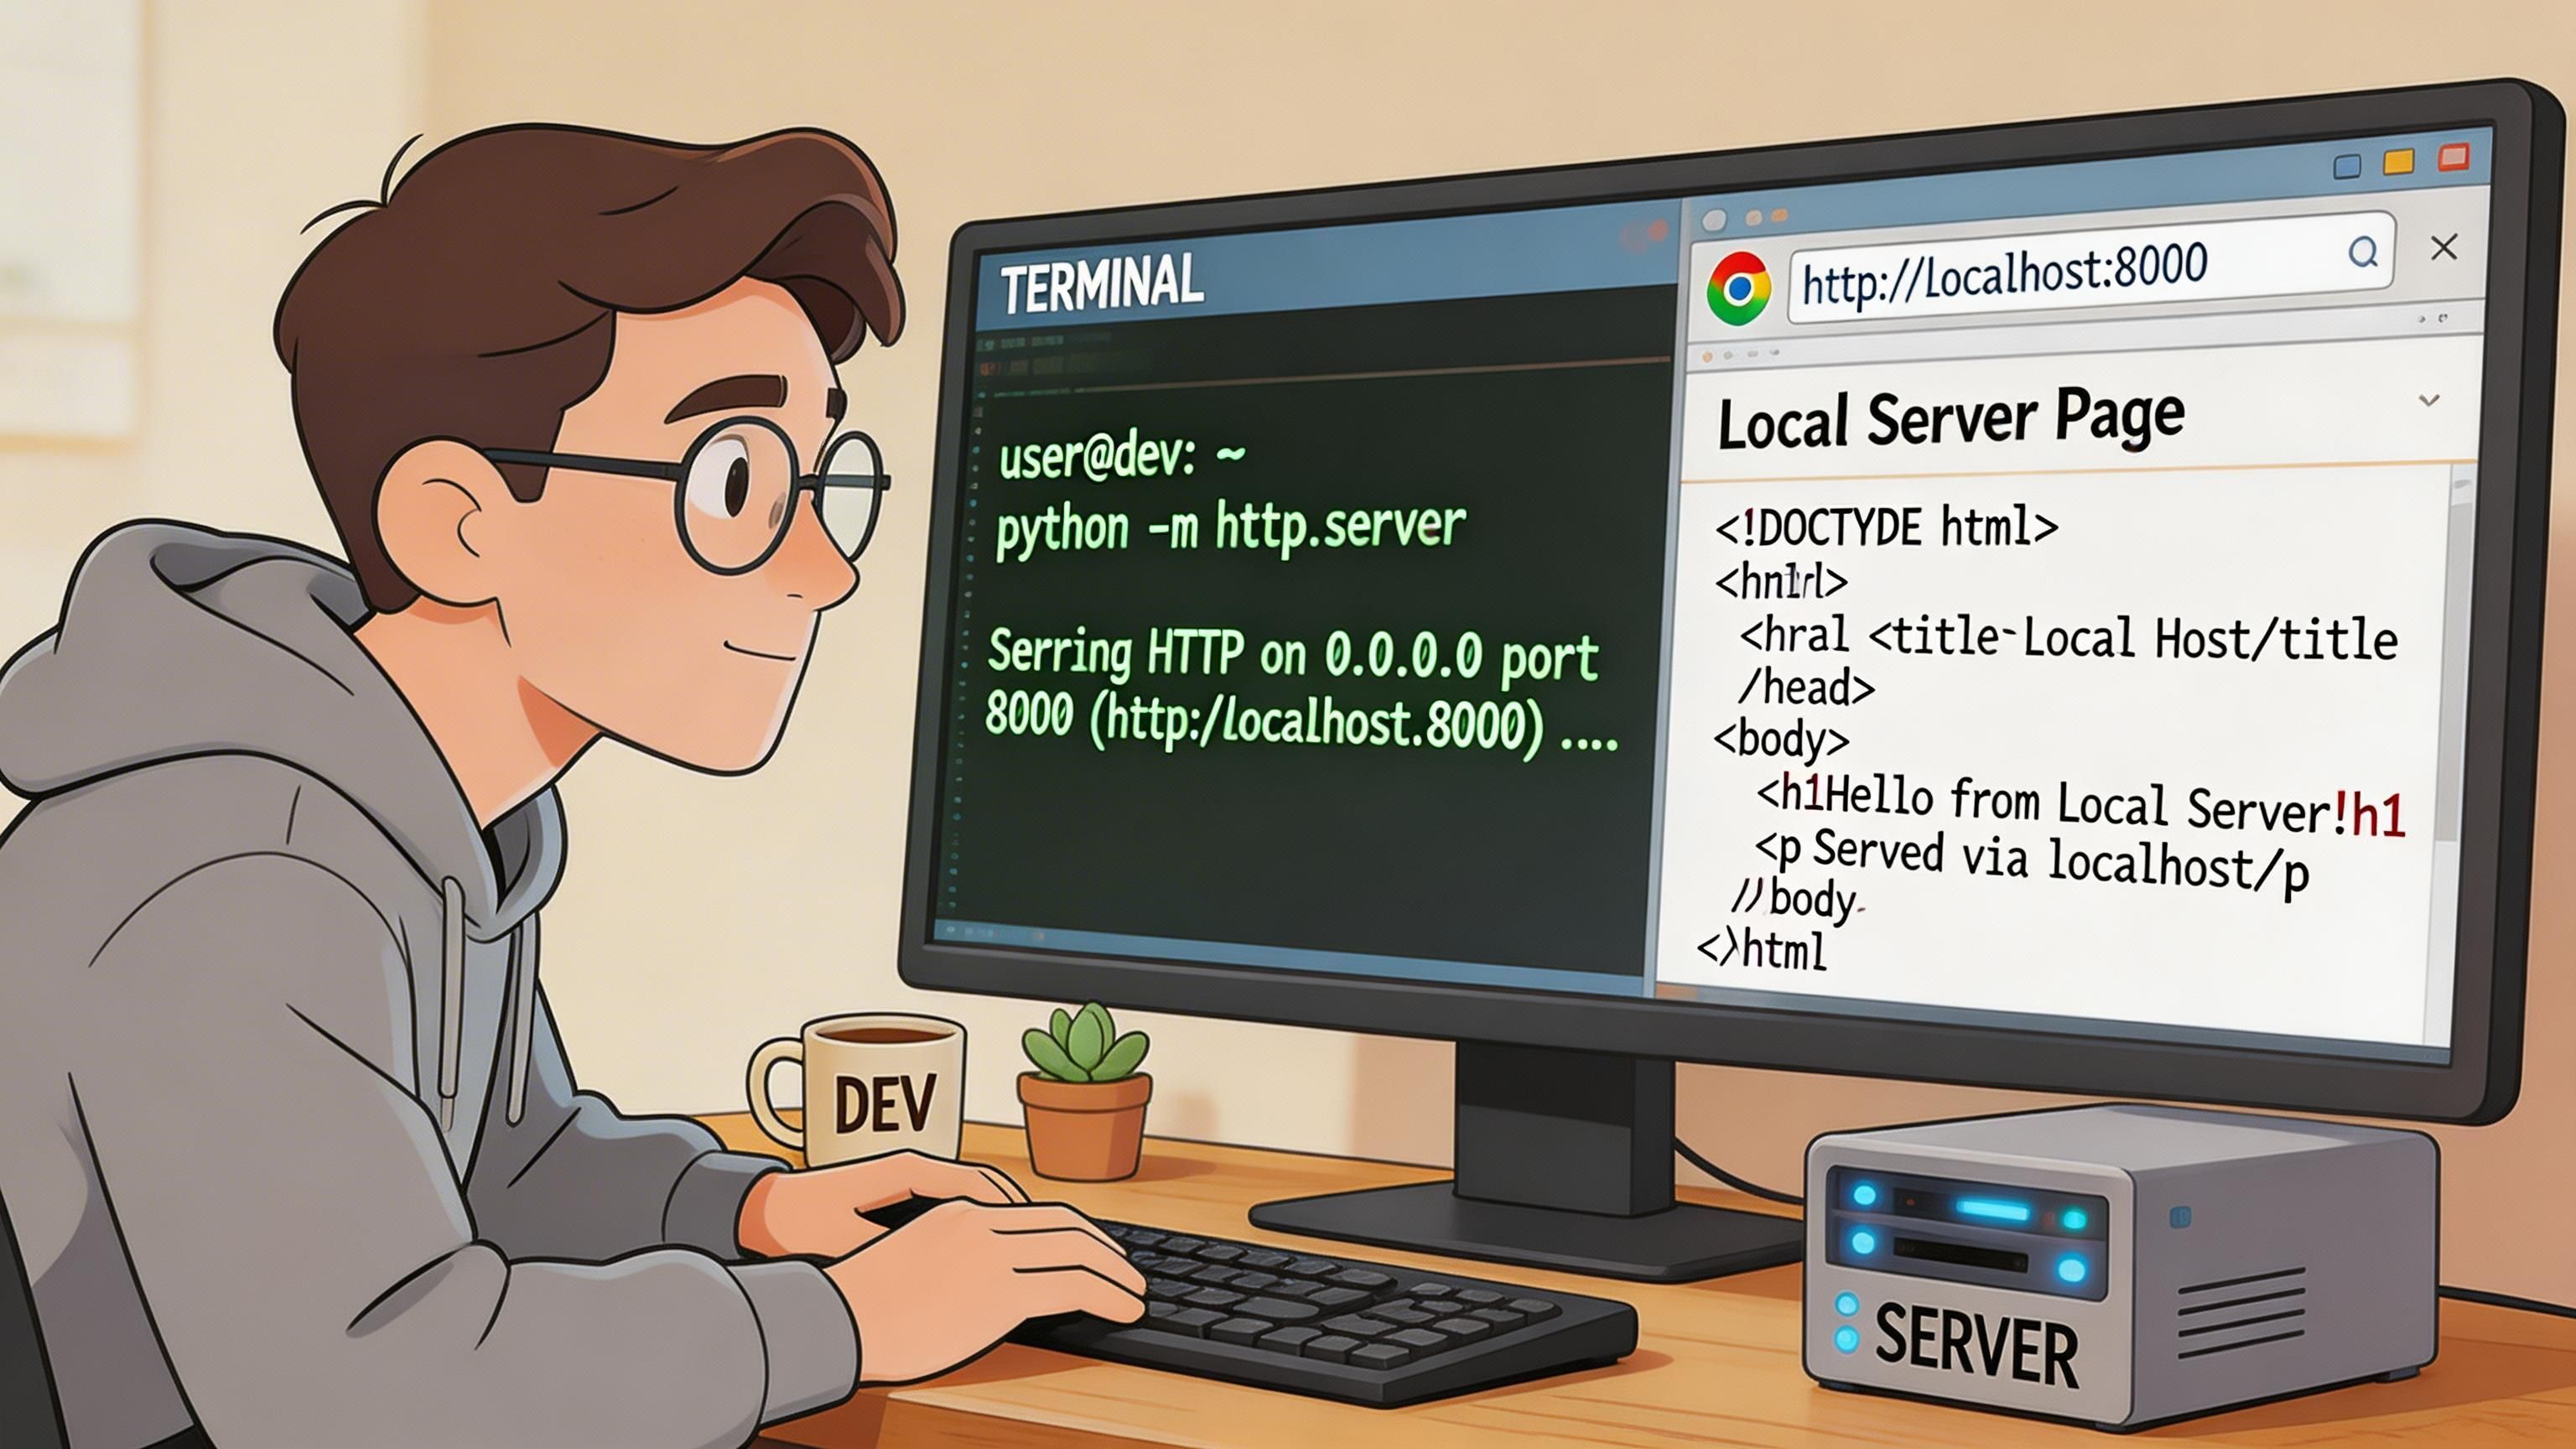
If someone says they want to “open HTML code in Chrome,” I first separate the goal. They may mean “show me the rendered page,” which direct file opening handles well, or “run this page in a browser-like environment so scripts, modules, and requests work,” which usually means localhost. Those are related tasks, but they are not the same task.
A quick comparison helps:
| Method | Best for | What commonly breaks |
|---|---|---|
Direct open in Chrome (file://) | static pages, rough layout checks, content proofing | fetch(), ES modules, stricter asset rules, app-like behavior |
| Localhost via Python | lightweight testing with realistic browser behavior | no auto-refresh, manual reloads, less convenient for repeated edits |
| Live-reload tooling | active front-end work, component iteration, repeated JS/CSS edits | extra tooling setup that can be unnecessary for a one-file preview |
Run a lightweight local server
If your HTML loads JSON, imports modules, references bundled assets, or depends on route-like behavior, serve it locally instead of opening the file directly.
Two easy options:
- Python
- Open Terminal in the project folder
- Run
python -m http.server - Open the local address shown in Terminal in Chrome
- live-server
- Install
live-serverthrough npm - Run it from the project folder
- Let it auto-refresh the page as files change
- Install
Why this works better:
- Assets resolve more predictably
- JavaScript features behave closer to production
- You avoid many local file restrictions
- Testing forms and interactive UI becomes less misleading
If you do repeated QA on templates or components, this should become your default habit. For a single static file, I still think direct open is fastest. For JavaScript testing, though, localhost is more reliable almost immediately, because it removes the question of whether the environment is lying to you.
Open files from the command line
Terminal-based opening is useful when you script tasks or move quickly between build steps.
Typical patterns look like this:
- macOS: use the system
opencommand with the file path - Windows: use a shell command that launches the file in the associated browser
- Linux: use your desktop environment’s open command or launch Chrome with the file path
The exact command varies by system, but the idea is the same. You stay in your shell, build or edit your file, then open it without switching contexts.
That’s especially nice when your workflow already includes linting, formatting, or test scripts.
When a local server is the better professional default
A junior dev often asks, “Do I really need a server if it’s just HTML?” Sometimes no. Often yes.
Use direct file opening for:
- Static mockups
- Single-page layout checks
- Content proofing
Use a local server for:
- JavaScript-driven components
- Accessibility behavior that depends on scripting
- Anything with fetch, imports, or route assumptions
For broader QA practice, this is the same mindset behind automated accessibility testing. Manual spot checks matter, but a stable local environment gives you better inputs before any automated scan runs.
Troubleshooting Common Local File Issues in Chrome
You double-click an HTML file, Chrome opens it, and the page looks fine at first. Then the button does nothing, fetch() fails, or a script loads on your laptop but not on a managed work machine. That usually points to local file restrictions, not a mysterious bug in your markup.
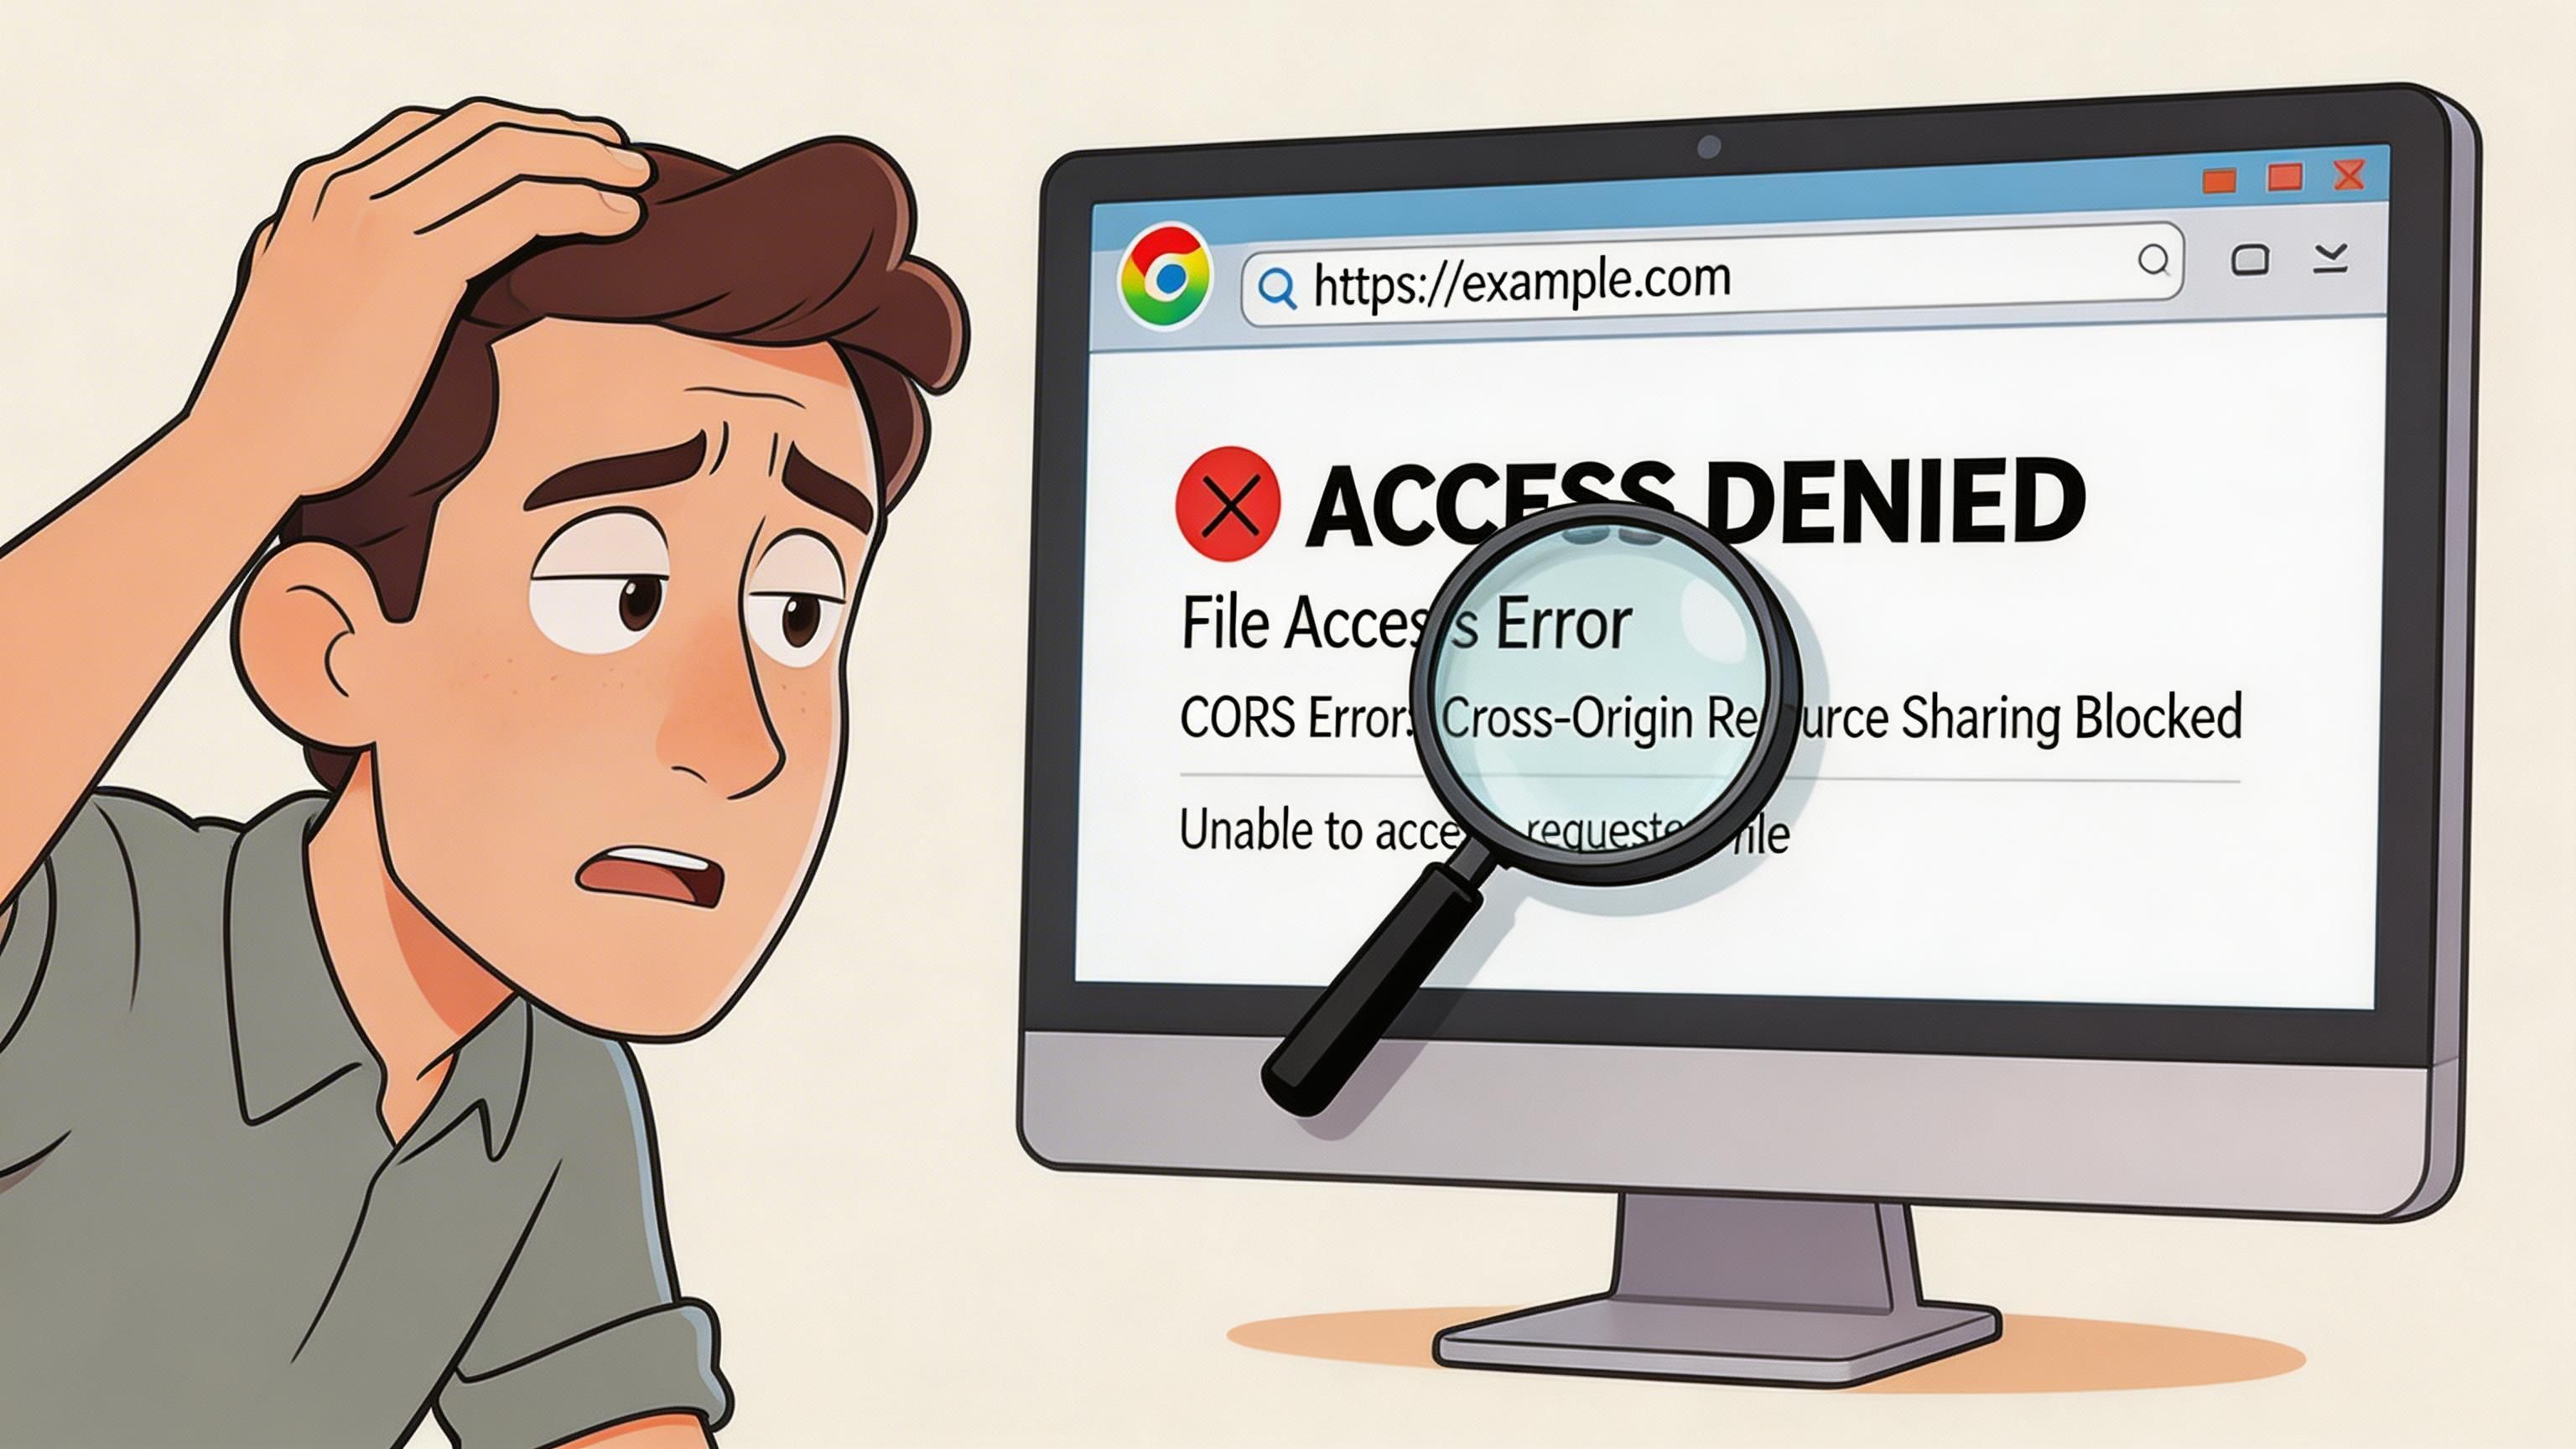
Why Chrome blocks local behavior
Chrome treats file:// pages differently from pages served over http://localhost. In plain language, file:// means the browser is opening a file directly from your machine, while http://localhost means the browser is talking to a local web server. That server context matters because browser security features such as origin checks, module loading rules, and request restrictions behave more like a real website there.
MDN documents this clearly: features such as fetch() and module loading are tied to origin rules and secure loading behavior, which is why local files often fail in ways that disappear once the same project runs on localhost, as explained in the MDN Fetch API guide and the MDN JavaScript modules guide.
In practice, the same file can behave differently based on where it lives. Downloads folders, synced cloud folders, network drives, and corporate-managed directories often add permission or policy issues on top of Chrome’s normal restrictions.
That matters for accessibility work too.
If you are testing keyboard interactions, client-side validation, ARIA updates, modal focus management, or live regions before deployment, a broken local script can make an accessible component look defective when the problem is the environment.
The failure patterns I see most often
Use this table to diagnose the issue quickly.
| Problem | Likely cause | Best fix |
|---|---|---|
| HTML opens but JS breaks | file:// restrictions on scripts, modules, or related assets | Start a local server in the project folder, reload from http://localhost, and retest before editing the code |
| CSS or images fail intermittently | incorrect relative paths or protected folder behavior | Open DevTools, check the failed asset path, then move the project into a normal local folder and correct the relative references |
fetch() requests fail | browser security rules for local resources | Serve the files over localhost, then confirm the request in the Network panel instead of retrying under file:// |
| Works on one machine, fails on another | enterprise policy, antivirus scanning, extension interference, or shared-drive restrictions | Copy the project to a local non-synced folder, disable extensions, compare browser policies, and test again on the clean setup |
For interactive pages, forcing file:// to behave like a deployed site usually wastes time. A local server gets you closer to production behavior and gives you more reliable accessibility checks.
| Problem | Likely cause | Best fix |
|---|---|---|
| HTML opens but JS breaks | file:// restrictions on scripts, modules, or related assets | Run the project on a local server |
| CSS or images fail intermittently | incorrect relative paths or protected folder behavior | move the project into a normal dev folder and verify paths |
fetch() requests fail | browser security rules for local resources | serve the files over localhost |
| Works on one machine, fails on another | enterprise policy, antivirus scanning, extension interference, or shared-drive restrictions | test from a local folder, compare policies, and retry with extensions disabled |
Workarounds, with the trade-offs
You will find advice that tells you to launch Chrome with the --allow-file-access-from-files flag. It can bypass some restrictions. I still avoid it for normal development.
The trade-off is simple:
- It changes Chrome’s security behavior.
- It can hide issues you would not have in a proper local or staging environment.
- It is a poor fit for managed company devices.
- It is easy to forget that Chrome is running with special settings.
For professional testing, especially accessibility QA, consistency matters more than convenience. If focus behavior, error messaging, or dynamic content depends on JavaScript, test in an environment that matches real delivery as closely as possible.
What to check before changing code
Run through this in order instead of guessing:
- Confirm the file itself opens. If Chrome cannot open the HTML file at all, the problem is probably the path, file association, or a moved/deleted file rather than your code.
- Check whether only CSS or images are broken. If the page opens without styling or images, inspect the file paths first. In my experience, this is often a relative-path mistake or an asset sitting outside the folder structure the HTML expects.
- Check whether JavaScript, modules, or
fetch()fail. Open DevTools and look at the Console and Network panels. If scripts or requests fail underfile://, switch to localhost before rewriting working code. - Check whether the issue is machine-specific. If it works at home and fails at work, compare folder location, browser policies, endpoint protection, and extensions before blaming the markup.
Start with the basics:
- Move the project out of Downloads.
- Avoid opening files from a shared or synced drive.
- Test from a fresh local project folder such as
Sites,Projects, or your repo workspace. - Disable interfering extensions temporarily.
- Open DevTools and check the Console and Network panels first.
If missing files turn out to be the issue, this guide on how to fix 404 errors in local and live environments is the next place to look. For extension conflicts during debugging, this roundup of best Chrome extensions for developers is also useful.
Pro Tips for Web Development and Accessibility Testing
A local page can look fine in Chrome and still fail the first real QA pass. That usually shows up in keyboard use, form behavior, or JavaScript-driven updates that never announce themselves properly.
Turn the preview into a real test pass
Once the file is open, treat it like a review build, not a screenshot.
Start with DevTools. Inspect the DOM and confirm that the structure in the browser matches the structure you meant to ship. Headings should be real headings. Buttons should be actual button elements when they trigger actions. Form fields need connected labels, and repeated div wrappers should raise suspicion.
Then check behavior, not just layout:
- Open the Console before clicking around. One JavaScript error can break focus management, validation messaging, or dynamic content updates.
- Use the Accessibility pane in DevTools to inspect names, roles, and states for interactive elements.
- Tab through the page in order. Watch where focus starts, where it gets trapped, and whether the visible focus style stays clear on every control.
- Resize the viewport or use responsive mode. Small-screen bugs often expose hidden text, clipped dialogs, and unreadable zoom behavior.
This is the point where local testing becomes part of professional accessibility work. If the page depends on scripts, async content, or custom widgets, a quick open-in-Chrome check is only the first pass. You still need to confirm that the behavior holds up in a served environment that matches production more closely.
What to check before the code leaves your machine
I’d review three areas first.
Semantic structure
Scan the page outline. Check heading levels, landmarks, lists, tables, and form labels. If the UI is built from generic containers with click handlers, expect extra accessibility work before it is ready.
Keyboard behavior
Test the full path a keyboard user takes:
- Tab order
- Visible focus states
- Enter and Space behavior on controls
- Escape handling in modals and menus
- Arrow key support for custom components such as tabs, menus, or listboxes
A page that opens correctly but fails here is not ready.
States and readable feedback
Check hover, focus, error, success, and disabled states. Confirm that error text is specific, that status changes are visible, and that contrast stays readable in each state. For forms, trigger invalid input on purpose and see what the user gets back.
Review habit: Ask "Can someone complete the task with a keyboard, at 200 percent zoom, and with JavaScript running as it will in deployment?"
Keep Chrome set up for inspection
A clean browser setup saves time. Use a separate Chrome profile for testing if extensions, saved sessions, or autofill keep masking issues. If you want a shortlist of useful tooling, this roundup of best Chrome extensions for developers is a good starting point for inspection and debugging. For another practical accessibility resource to pair with your local browser checks, see more from Uxia.
My rule is simple. If the page is static, a local open is fine for structure and content checks. If it includes fetch requests, modules, form validation, dialogs, or other interactive behavior, test it locally in Chrome first, then verify it again in a local server setup before you trust the result.
Frequently Asked Questions
Can I open an HTML file in Chrome on my phone or tablet
Sometimes, yes, but it’s less convenient than on desktop.
Mobile devices don’t usually give you the same file-system control or developer tooling. For serious testing, open the file on desktop Chrome first, then use responsive mode or a local server to check mobile layouts.
Is it safe to open an HTML file from an unknown source
Treat it carefully.
An HTML file can include scripts and external references. If you didn’t create it or don’t trust where it came from, avoid opening it casually. Review it in a code editor first, and don’t use security-bypassing launch flags just to make it run.
How do I view or inspect HTML code in Chrome
Open the file in Chrome, then right-click the page and choose Inspect to see the live DOM in DevTools. If you want the original markup instead of the live DOM, use View Page Source or the Ctrl+U / Cmd+Option+U shortcut. Use DevTools when you need to inspect elements after JavaScript runs, and source view when you want to verify the file’s raw HTML.
Why does my CSS or JavaScript not load correctly
First confirm whether the page is being opened through file:// or served through localhost.
If CSS or images fail, check relative paths in DevTools and make sure the project is in a normal local folder. If JavaScript, modules, or fetch() fail, stop testing under file:// and run a local server instead.
Why does the file work on my laptop but fail at work
Corporate environments often add browser policies, endpoint protection, restricted folders, and shared-drive rules. Those controls can change how Chrome handles local files.
Move the project into a normal local dev folder and test again. If it still fails, compare the browser environment, not just the code.
What’s the best method overall
For a quick visual check, drag-and-drop or Ctrl+O is hard to beat.
For dependable development work, especially if you’re testing scripts, components, or accessibility behavior, use a local server. That gives you a setup closer to reality and saves time debugging problems caused by the local file protocol itself.
Web accessibility work gets easier when your local testing process is solid from the start. If you want a platform that helps your team monitor accessibility continuously, scan for issues, and support compliance workflows at scale, take a look at WebAbility.io.
Quick Questions
Tap to ask AI about this article